
Student Competition Paper Winner, Andrea Bryson: Access to Public Schools via Public Transportation in Chicago
Author: Andrea Bryson, University of Illinois Chicago – Masters of Urban Planning and Policy
Abstract
Chicago Public Schools provides many high school options for students, but students who choose to attend schools outside of their neighborhood may have their options limited by their transportation options. Transportation modes in Chicago include walking, biking, riding in a private vehicle and public transportation. Walking, biking and riding in a private vehicle may not be available for all students and therefore they are left with public transportation as the only option. This paper hypothesized that not all students have the same amount of school choice due to transportation limitations. It looked at how many schools that students could access via public transportation in 30 and 60 minutes. It found that regions in the far south side including Greater Midway, South Side, Greater Stoney Island, Greater Calumet and Far Southwest Side do not have many school choices if they are taking public transit. These choices are further limited if they are looking to attend a top school. It is recommended that CTA work to improve bus speed to improve travel speeds between neighborhoods to better serve the populations that are not looking to travel downtown.
Introduction
Having good schools within a short commute is important for many reasons. First and foremost, this leads to better outcomes for children, but it is also vital for a good for city because without this service it is hard to keep families.
Many parents put a high priority on sending their kids to a top school. With more focus on school quality parents and school districts and government have been looking for ways to expand student choice. Some districts such as Chicago have programs where students can apply for schools other than their neighborhood school. In Chicago this shift happened from 2002 to 2016 when the number of high schools almost doubled due to selective enrollment, charter and special program schools opening (Barrow & Sartain, 2017). If students do not have this option or do not get into a school that is acceptable parents who can afford it may send their child to private school. In Chicago 23% of
students between the ages of 15 and 19 attend private schools (U.S Census Bureau, a). To help enable school choice governments have instated school vouchers; these programs give money to parents to spend on private schools. In Illinois the “Invest in Kids Act” was a voucher program in effect from the 2017-2018 school year until the 2023-2024 school year (Illinois Families for Public Schools, a). This program was not renewed but larger programs are in place in the neighboring state of Wisconsin, Indiana and Iowa (Illinois Families for Public Schools, b). Finally, parents exercise school choice by choosing to live within the attendance boundaries of high-quality schools.
Having a short commute to school is important for the well-being of the child. Research shows that long commutes had the biggest impact on the amount of sleep and exercise a student gets while having a much lower effect on other extra-curricular activities (Voulgaris et al., 2017). Students with a commute time of less than 30 minutes get an hour and fifteen minutes more in exercise than students with a commute longer than 30 minutes (Voulgaris et al., 2017). In addition, for every minute spent commuting students lose on average 1.3 minutes of sleep (Voulgaris et al., 2017). This means increasing a commute from 30 minutes to 60 minutes would result in 40 minutes less sleep. The reduced amount of sleep and exercise a student has can have larger impacts on their health and wellbeing.
Background
This paper will research Chicago and the access students have to schools via public transportation. To begin this research, it is important to understand how the CPS, current school transportation options and the public transportation systems in Chicago operate.
Chicago Public Schools
The mission of the CPS is “To provide a high-quality public education for every child, in every neighborhood, that prepares each for success in college, career, and civic life (CPS,b). The 2022-2025 Three-Year Blueprint lays out how CPA plans to meet its mission. The blueprint has three main areas; Academic Progress, Operational Excellence and Building Trust (CPS, b).
Within Chicago there are 176 High Schools for students to choose from. These schools are a part of neighborhood programs, choice programs, or selective enrollment programs run by CPS, or are charter schools not operated by CPS but still free for residents (CPS, c). Students are guaranteed entry into their neighborhood programs while choice and selective enrollment programs require an application. In the “Reimagining” section of Blueprint it states, “redesign our admissions and enrollment policies and processes to ensure that they are responsive, accessible, and equitable for all families (CPS, b).” While the district is looking to reimagine the admission process for these schools, even if students are admitted they may be restricted by their ability to travel to school.
CPS releases the Annual regional Analysis that covers topics such as the quality, quantity, choice and variety the school district provides. The CPS annual regional analysis uses 16 regions to look at different outcomes across the city (figure 1). These regions were defined by the Department of Planning and Development using natural boarders, and research on housing and employment (CPS,a). These regions will be used throughout this paper.

Figure 1: CPS regions.
Source: CPS, a
Transportation to Schools
There are 95,706 students who attend CPS high schools (CPS, a). Transportation choices for students traveling to school can include walking, biking, school buses, private vehicles, and public transportation. Walking or biking to school requires the distance to be short (CPS, a). 45% of students live more than 3 miles from school and are unlikely to choose an active mode of transportation (CPS, a). Theoretically, the other 55% could walk or bike to school; however, this brief analysis does not look at the safety of those routes.
During COVID many school bus routes were cancelled due to a driver shortage (CPS, d). Despite having the goal “Ensure that all eligible students have access to transportation services” in the three-year blueprint bussing was not resumed when schooling resumed in person (CPS, d). CPS is required to provide transportation services to students who are disabled or unhoused but is not required to provide transportation to any other students (CPS, d). In 2025, only 5% of students are federally required to be provided with transportation (McMurray, 2025). The remaining 95% is not guaranteed bussing. This year CPS started running “hub stops”. This is a system where a bus picks up students from a local school rather than their house to be brought to a school outside of their neighborhood (McMurray, 2025). The first hub stops were chosen based on school capacity, operational readiness and the CPS Opportunity Index (CPA, d). It is unclear what the current hub stops and routes are and how many students are receiving these transportation services. If school buses are not an option, then students could either be driven to school or drive themselves. In Chicago 26.7% of households do not own a vehicle and 45.0% only own one vehicle (U.S Census Bureau, b). For these households, driving a student to school would be challenging, if not impossible. With all these options exhausted, the final option is CTA. If a student cannot reasonably access all the schools in the district via CTA, then they do not have the same amount of school choice as their peers with more abundant transportation options.
Public Transportation in Chicago
Chicago has a robust public transportation system. The system includes CTA Bus, CTA Rail and Metra. The city has good public transit coverage but was designed to move people to the Loop. Although the Loop has many jobs, it does not contain many schools. Figure 2 shows the CTA bus network and the coverage it provides for Chicago. Figure 3 shows the CTA rail and how all lines lead to downtown with only the Red Line traverses the city north to south.
Recently, the CTA has seen an increase in the percentage of riders that are student- aged children (CPS, d). Riders under 18 now make up 4% of riders compared to 1% in 2016 (RTA, 2022). The percentage of trips with the purpose of traveling to and from school increased from 5% in 2016 to 13% in 2022 (RTA, 2022). Both statistics show that students are creating a demand for transit and therefore the CTA should ensure it is delivering for those students.

Figure 2- CTA Bus Network 4. Created By- Andrea Bryson.jpg
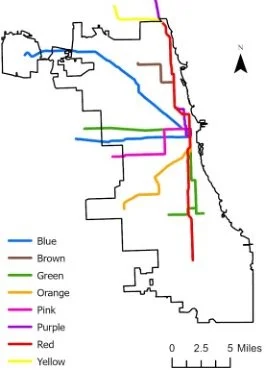
Figure 3: CTA Rail Network5. Created by: Andrea Bryson.
Problem Statement
Providing high quality schools that any student in Chicago can apply to does not create equal opportunity if students do not have the means of transportation to get there in a reasonable time.
Objective
The objective of this study is to determine the number of overall schools and top schools that students have access to and provide some public transportation solutions that could expand access.
Methods
In this analysis, the travel time from census block groups to high schools was collected using data from Google. The inputs to Google were the starting location latitude and longitude, the ending location latitude and longitude, the arrival time, the date and transit as the mode of transportation. The outputs included travel time, transit legs, and total walking distance. Only the travel time was used in this analysis.
The starting location used the census block groups. Census block groups were converted from polygons to points in ArcGIS. The points used were the center of each census block group. Five of the census block groups were not used in this study because they did not have any population. These census block groups covered O’Hare airport, Midway Airport, Millenium Park and Lincoln Park.
The ending locations were each of the high schools in Chicago; this included schools operated by CPS, as well as charter schools. There were a total of 170 schools included in the initial dataset. Schools were removed to decrease the data collection needs. All schools with fewer than 100 students were removed. There were 16 of these schools and they served 1% of the high school student population. An additional four schools were removed because they were special education schools, serving students who would most likely be eligible for dedicated transportation services. Finally, there are some locations that host multiple schools. In these cases, the schools were removed for data collection but were accounted for in the analysis. A total of 150 schools were included in the analysis.
Providing accurate time and date was important for acquiring accurate travel time data. Monday, May 19th was chosen for the date to ensure that students were in school and not on spring break or summer vacation. The arrival time used was 15 minutes prior to school starting. If data for a school was not available, 8am was used since it was the most common school start time for high schools.
It was important to consider not only how many schools students have access to but also the quality of school. To achieve this, the analysis was first performed using all schools and then performed using schools in the top quartile. Schools in the top quartile were determined using an index that equally valued the percent graduation in 4 years and percent college admittance. Any school that did not have either of those data points was omitted from the index. 131 schools had data for both graduation and college admittance. Quartiles were calculated from the 131 schools with 31 to 32 schools falling in each quartile. In all scenarios the block groups were grouped into 5 equal groups (quintiles) to determine with block groups had the greatest access.
Once the data collection was done, a few different analyses were completed. First, the travel time from each block group to their neighborhood group was mapped to show how well transit served students traveling to their neighborhood school. Then, the number of schools that could be reached in 30 minutes and 60 minutes from each block group was counted and mapped. 30 minutes was used as the first cut off because of the significant declines observed in students’ time spent exercising when they have a commute longer than 30 minutes. The same analysis was done a second time; however, only the top schools were counted.
Results & Conclusion
Neighborhood schools are well distributed across the city. There are 45 neighborhood schools and neighborhood school boundaries. Only a few block groups were more than 45 minutes away from their neighborhood school (Figure 4). The majority of block groups were within 30 minutes of their neighborhood school. This shows that if students predominantly went to their neighborhood high schools, then long commutes to school would not be a problem that needs to be addressed. However, only 25% of students attend their zoned high school (CPS, a). 32% attend another high school within their neighborhood while the remaining 43% of students travel to a school outside of their zone (CPS, a).

Figure 4: Travel Time to Neighborhood Schools. 1&2 Created By: Andrea Bryson
There are many reasons a student may attend a school other than their neighborhood school. One of those reasons is to attend a school with better academic achievement. The school index identified the top quartile of schools based on graduation and college acceptance rates. While there is a good distribution of high schools across the city, high schools that fall in the top schools are concentrated on the north side of the city. Only seven out of 37 schools fall on the south side of the city. None of those schools are south of 65th Street. Due to the unequal distribution of top schools in the city, it is important to quantify the impact this has on students’ school choices. Four out of the top 37 schools are neighborhood schools. Those schools are Amundsen, Taft, Lincoln Park and Kenwood Academy High Schools, students in those neighborhoods would automatically be able to attend a top school.

Figure 5: All Chicago High Schools 2

Figure 6: Top Quartile of High Schools 2&3
The next analysis looked at how many schools a student can access in 30 or 60 minutes. This measurement was used because it demonstrated the amount of choice a student has if their only mode of transportation available is public transportation. Students in the Near West (7) have the most options within 30 minutes. Some areas in the Greater Milwaukee (4), West Side (6), Central Area (8), and Pilsen/Little Village (9) regions also have a good number of options within 30 minutes.

Figure 7: Number of Schools accessible in 30 minutes.9&10 Created by: Andrea Bryson.

Figure 8: Number of Top Schools accessible in 30 minutes. 9&10 Created by: Andrea Bryson
When looking at access to only the top schools, block groups with the greatest choice had access to 12 schools in 30 minutes. Figures 10 and 11 show how the areas with the greatest access shift. Areas in the West Side. Pilsen/Little Village and Greater Stoney Island all had block groups that were in the top 20% of access when all schools were being included. While those areas fell out of the top 20%, areas in Greater Lincoln Park entered the top 20% of access.

Figure 9:
Access to schools via a 30 minute or less trip on public transportation by block group. Block Groups are divided into five quantiles that each have an equal number of block groups. 9 &10 Created By: Andrea Bryson.

Figure 10:
Access to top schools via a 30 minute or less trip on public transportation by block group. Block Groups are divided into five quantiles that each have an equal number of block groups. 9 & 10 Created By: Andrea Bryson.
A similar trend is observed for the 60-minute commute. A large area that radiates out from downtown on all sides all has access to 50 or more schools. Some block groups had access to 83 schools. In this analysis, block groups on the edges of the city had the
least amount of access. Block groups with the greatest choice of top schools had access to 15-16 schools. These block groups were mostly located in the Greater Milwaukee Avenue, West Side and Central Area regions.

Figure 11:
Access to schools via a 60 minute or less trip on public transportation by block group. Block Groups are divided into five quantiles that each have an equal number of block groups. 9 &10 Created By: Andrea Bryson.

Figure 12:
Access to top schools via a 60 minute or less trip on public transportation by block group. Block Groups are divided into five quantiles that each have an equal number of block groups. 9 & 10 Created By: Andrea Bryson.
Discussion
Based on these findings, public transportation improvements need to be made to improve access to the top schools which are located on the north side of the city for students living on the far south side of the city.
Transit Recommendations
When looking at which areas have the best access to schools via public transportation it is important to consider where the schools are in relation to the public transportation system. To improve access to top schools the public transportation system needs to be able to move students across the city quickly. While the CTA bus system provides coverage across the city, the lack of dedicated lanes makes taking the bus across the city slow. While the CTA rail has a dedicated right-of-way and therefore moves more quickly, it is designed to bring people to the loop. This does not serve students well because there are only two high schools that are located within the loop and only one of those is a top school. Additionally, the rail lines do not reach the far south side of the city (Figure 13).
Figure 13:
Access to top schools via a 60 minute or less trip on public transportation by block group with Rail Overlay. Block Groups are divided into five quantiles that each have an equal number of block groups. 4 & 10 Created By: Andrea Bryson.
Short Term
In the short-term public transit should look at improving the north/south travel time on buses. This could be achieved in multiple ways. The first option would be to operate an express bus that is tailored to school access. These routes should be explored along Ashland, Damen, Grand and Pulaski. There are 3 top schools within a half mile of the current Ashland bus. This bus should stop at all normal stops from the southern terminus until 75th street to pick up students. The only two stops it should after that point should be at Jackson and Erie, two schools will be accessible from the Erie stop. The Damen bus is currently split into two routes. These routes should be joined into one using Western to get around the rail yard near 43rd Street. Removing this transfer will speed up the route. This bus should make all stops until 62nd Street to pick up students. The first top school could also be access at the 62nd Street stop. It should then run express making stops at 47th Street, Roosevelt Road, Adams Street and Foster Avenue to provide access to schools. The Pulaski Bus is also split into two routes which should be joined to remove the transfer. It should make all stops until 55th Street where the first top school is located and then run express making stops at 51st Street, Cortland Street, Irving Park Road and Peterson Avenue. The final bus is Grand. This bus should run an alternative route on the east end. It should start at the VanBuren Station, stopping at LaSalle Station and Union Station before traveling north to Grand where it will continue along its normal route. Once making the stops at the three Metra stations it should stop at Ada Street, Washtenaw Avenue, Kedvale Avenue and Mango Avenue.
The changes in the Grand bus should be paired with providing subsidized fare cards for Metra to students residing on the far south side of Chicago. With this combination of changes students could use the Metra service to travel downtown quickly before transferring to a CTA route for the final transit leg.

Figure 14: Bus Lines and Metra Stations mentioned in Recommendations. 2, 4, 7 & 8 Created By: Andrea Bryson
Long-Term
In the long-term public transit agencies should shift their goals from just moving people to and from downtown to moving people from one neighborhood to another. This would include improving bus service by adding bus rapid transit along key bus corridors that are not well served by the rail.
Strengths and Limitations
This paper takes a novel look at school choices in Chicago by considering not just the schools that are available to the students but also the ability to travel to the school via public transportation. It recognizes that without school buses or a personal vehicle certain schools may be unattainable for students. The research was broad in terms of the area it covered but could benefit from looking deeper into factors impacting the likelihood someone will use public transportation to get to school. These factors could include demographic and neighborhood characteristics.
Future Research
The availability of transit may not be enough for a student to view it as an option. Further studies should look at other factors that may contribute to transit use to get to school. This would include the perception of transit, the perception of safety while taking transit, safety on transit, and crime in home neighborhood. Further studies could also include a survey component asking parents and students if transportation is a contributing factor to their school choice along with what modes of transportation they would consider taking.
Future research should also consider demographic data such as vehicles in the household and income to identify block groups where students are most likely to be dependent on public transportation as their mode of transportation to school
Conclusion
Chicago Public School provides many high school options for students. If students do not want to attend their neighborhood high school, they theoretically can apply to selective enrollment programs, charter schools or choice programs. While this appears to provide students with plenty of choice, students with limited transportation options may not be able to access all the options. This paper looked at how many schools that students could access via public transportation in 30 and 60 minutes. It found that regions in the far south side including Greater Midway, South Side, Greater Stoney Island, Greater Calumet and Far Southwest Side do not have many school choices if they are taking public transit. These choices are further limited if they are looking to attend a top school.
Recommendations to improve access to these students include creating special express bus routes with frequent stops in areas with low access to pick up students and only stopping near schools in areas with already high access. Expanding the fare cards that CPS provides to include Metra for students on the Far South Side could also improve access by enabling students to travel quickly downtown. In the long-term, the CTA should look at large improvements such as Bus Rapid Transit to improve movement between neighborhoods because the current system built to get people downtown does not serve the needs of all residents.
References
Barrow, L., & Sartain, L. (May, 2017). The Expansion of High School Choice in Chicago Public Schools. Economic Perspectives, 41(1).
https://www.chicagofed.org/publications/economic-perspectives/2017/5
Chicago Public Schools (n.d). Annual Regional Analysis 2024-2025. Retrieved: April 29, 2025. https://www.cps.edu/sites/ara/district-overview/
Chicago Public Schools (n.d). CPS’s Three-Year Blueprint, 2022-2025. Retrieved: April 29th, 2025. https://www.cps.edu/about/blueprint/
Chicago Public Schools (n.d). Go CPS; Explore High Schools. Retrieved: April 29, 2025. https://www.cps.edu/gocps/high-school/explore/
Chicago Public Schools (n.d). Transportation Services. Retrieved: April 29th, 2025. https://www.cps.edu/services-and-supports/transportation-services/#a_hub- stops-for-sy24-25
Illinois Families for Public Schools (n.d). Game Over for School Vouchers in Illinois.
Retrieved: April 29, 2025. https://www.ilfps.org/sunsetilvouchers
Illinois Families for Public Schools (n.d). Voucher Expansion in the Midwest. Retrieved: April 29, 2025. https://www.ilfps.org/voucher_expansion_in_the_midwest
McMurray, J. (January 5, 2025). Chicago Students without Bus Service Getting PiggyBack Rides to School. Associated Press.
Regional Transportation Authority (November, 2022). CTA 2022 Customer Satisfaction Survey. https://www.rtachicago.org/uploads/files/general/Region/CTA-CSS-2022- Final-Report.pdf
United States Census Bureau (n.d) B14003: Sex by School Enrollment by type of School by age for the population 3 years and over: 2023: ACS 5-Year Estimate Subject Table. Retrieved: April 30, 2025.
https://data.census.gov/table/ACSDT1Y2023.B14003?t=Type+of+School&g=160XX0 0US1714000
United States Census Bureau (n.d) DP04: Select Housing Characteristics: 2023: ACS 5-Year Estimate Subject Table. Retrieved: April 29, 2025.
https://data.census.gov/table/ACSDP5Y2023.DP04?q=vehicle+ownership&g=160X X00US1714000
Voulgaris, C. T., Smart, M. J., and Taylor, B. D. (2017). Tired of Commuting? Relationships amount Journeys to school, sleep and exercise among American Teenagers. Journal of Planning Education and Research, 2019, Vol, 13(2) 142 – 154.
Data Sources
1 Chicago Public Schools (September 27, 2024). Chicago Public Schools – High School Attendance Boundaries SY2425. Retrieved: April 29, 2025.
https://data.cityofchicago.org/Education/Chicago-Public-Schools-High-School- Attendance-Boun/4kfz-zr3a/about_data
2 Chicago Public Schools (October 3, 2024). Chicago Public Schools – School Locations SY2425. Retrieved: April 29, 2025.
https://data.cityofchicago.org/Education/Chicago-Public-Schools-School- Locations-SY2425/hexd-c4gn/about_data
3 Chicago Public Schools (April 15, 2025). Chicago Public Schools – School Progress Reports SY2425. Retrieved: April 15, 2025.
https://data.cityofchicago.org/Education/Chicago-Public-Schools-School-Progress- Reports-SY2/twrw-chuq/about_data
4 Regional Transit Authority (n.d.). RTA Mapping & GIS Portal: CTA Bus Routes Q1 2025.
Retrieved: April 29, 2025. rtagis.maps.arcgis.com/home/index.html
5 Regional Transit Authority (n.d.). RTA Mapping & GIS Portal: CTA Rail Lines. Retrieved: April 29, 2025. rtagis.maps.arcgis.com/home/index.html
6 Regional Transit Authority (n.d.). RTA Mapping & GIS Portal: CTA Rail Stations. Retrieved: April 29, 2025. rtagis.maps.arcgis.com/home/index.html
7 Regional Transit Authority (n.d.). RTA Mapping & GIS Portal: Metra Stations. Retrieved: April 29, 2025. rtagis.maps.arcgis.com/home/index.html
8 Regional Transit Authority (n.d.). RTA Mapping & GIS Portal: Metra Rail Lines. Retrieved: April 29, 2025. rtagis.maps.arcgis.com/home/index.html
9 Shoffner, J. (November 17, 2023). ARA_Regions.
https://services9.arcgis.com/eNX73FDxjlKFtCtH/arcgis/rest/services/ARA_Regions/ FeatureServer
10 U.S Census Bureau (2024). TIGER/Line Shapefiles: Block Groups; Illinois. Retrieved: April 15, 2025. 2024 TIGER/Line® Shapefiles